
Debug logs are a key tool in triaging and profiling on the Lightning Platform (formerly Force.com) both in development and production. While the Apex Interactive Debugger provides an interactive experience, sometimes you want to monitor, parse or filter logs. Maybe you are reproducing a bug and are watching for a certain SOQL query or method being executed or we just want filter output in different ways.
A recent addition to the DX command line from Chris Wall is the ability to effectively stream debug logs from any org connected to DX to the command line console. This is similar to the experience in Developer Console logs pane, but is effectively opening the logs and dumping them out as they are produced on the server for you automatically.
sfdx force:apex:log:tail
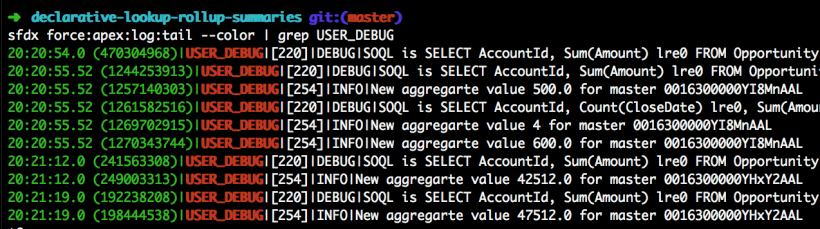
In the following command line example, I have piped the output to another command (grep) that filters the output to show only USER_DEBUG log lines.
sfdx force:apex:log:tail --color | grep USER_DEBUG
Pictures do not really do it justice, so here is a short demo video!
The command works against any org you have connected to the DX CLI, including production and sandbox orgs. However, if you run it from the same folder as a DX project it will use the currently configured default user/scratch org for that project.
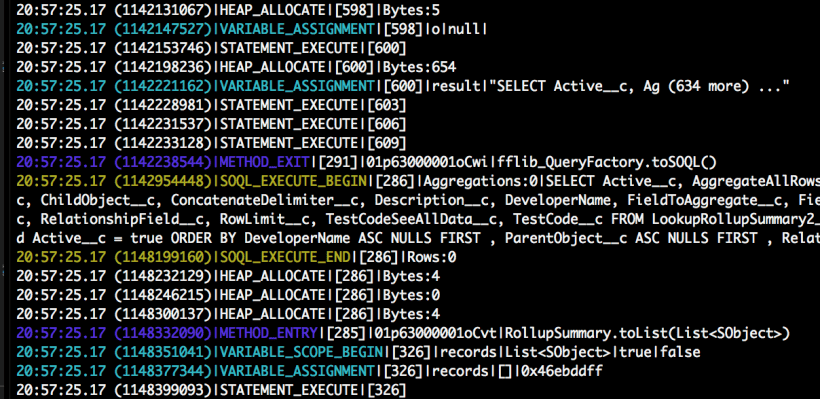
Adding a bit of color to your debug logs!
The –color parameter used above enables some basic color highlighting for method, constructor, variable assignments etc.
You can also customize your own colors by setting the SFDX_APEX_LOG_COLOR_MAP environment variable to an absolute file path to a JSON file per the format shown below.
{
    CONSTRUCTOR_: 'magenta',
    EXCEPTION_: 'red',
    FATAL_: 'red',
    METHOD_: 'blue',
    SOQL_: 'yellow',
    USER_: 'green',
    VARIABLE_: 'cyan'
}
Power to the pipe!
One of the most exciting features for me is the ability to pipe debug logs. Maybe you want to parse out some information to profile how many SOQL statements have been used or aggregate timestamp values (the bit in brackets after the time!) to do some performance profiling… I am looking forward to seeing what folks do with this, please share!
Anything else?
The –debugLevel command is optional but allows you to define your own debug level by inserting records into the TraceFlag object (via the DX CLI command force:data:record:create). Finally, you can run the command with the –help parameter to get the latest help.
Usage: sfdx force:apex:log:tail [-c] [-d ] [-s] [-u ] [--json] [--loglevel ]

start debug logging and display logs

Flags:

 -c, --color                          colorize noteworthy log lines

 -d, --debuglevel DEBUGLEVEL          debug level for trace flag

 -s, --skiptraceflag                  skip trace flag setup

 -u, --targetusername TARGETUSERNAME  username or alias for the target org;

                                      overrides default target org

 --json                               format output as json

 --loglevel LOGLEVEL                  logging level for this command invocation

                                      (error*,trace,debug,info,warn,fatal)

Pingback: Around the Web – 20180316 - WIPDeveloper.com
Pingback: Streaming Debug Logs to your console — Andy in the Cloud – Fawcett Eugene Alias fawcy
March 20, 2018 at 1:51 pm
I wish they would make PushTopic channels like /systemTopic/Logging that make this function official. Last I checked these were only for “internal services” like the developer console. Ref: https://salesforce.stackexchange.com/a/57217/102
Still, an interesting idea to have a command open and consuming the Streaming API. I’ll have to see about how to integrate it with my logging plugin. http://www.fishofprey.com/2017/09/teaching-old-log-parser-new-tricks-fit.html
April 23, 2018 at 5:10 pm
Andy,
Wondering whether you would consider adding capability of removing custom metadata records in your code base. Could you point me to something? Very nicely done, BTW.
April 24, 2018 at 7:34 am
So the native Apex MD API Salesforce provides does not permit this operation. However you could emulate a soft delete by having a deleted field on your object, that you update for delete and query for when listing the records. It’s not ideal but it’s the best without going back out to the SOAP Metadada API, which does support it. If you want to go that route take a look at the code in my rollup tool, the Manage Rollup Summaries vf page and controller does it. Hope this helps. 👍🏻
April 25, 2018 at 5:03 am
Hey Andy,
Can we also use this or any other way to query the debug logs via API?
Let’s say we want to take all the debug logs generated by our system and save them to an external database. Is there a way to accomplish something like this with the current APIs/tools available?
Thanks!
BTW – cool idea and very interesting
May 18, 2018 at 4:39 pm
Currently Salesforce does not expose the steaming api this uses. It’s a good use case though. Meanwhile you can pipe output from this command to another command or use the tooling api direct to pole on a scheduled basis for new debug logs via the DebugLog object. Note that you need to enable TraceFlag to start debug log output on the server side. https://developer.salesforce.com/docs/atlas.en-us.api_tooling.meta/api_tooling/tooling_api_objects_traceflag.htm
Pingback: Tools | Andy in the Cloud – Kay Scott's Blog
September 20, 2019 at 5:33 am
Hello Andy,
Is there a way to search through all the logs in an org?
December 28, 2019 at 7:10 pm
Sadly no.
October 22, 2020 at 11:29 pm
Hi Andy, thank you so much, I tried to replicate this on ubuntu and windows but neither of both worked, may be I did something wrong. Do you know if this is still working for you?
Thank you in advance!
December 31, 2020 at 8:56 pm
Yeah i think i tried it a few weeks ago and it was working fine. I am on Mac though. I would recommend you raising an issue on the GitHub page for the tools. https://github.com/forcedotcom/sfdx-core