
In my other blogs, I have focused on how Heroku’s elastic services can add additional powerful and scalable features to your Salesforce applications, seamlessly extending existing Flow and Apex investments in doing so. This blog, however, focuses on another use case that Salesforce developers can also find themselves involved in—and that is building integrations with Salesforce data.
Heroku’s fully managed services also make a great choice to keep focused on the task of building your integration apps and services, such as ingesting data transformations, filtering, aggregations, as well as supporting you in building user experiences you might need to deploy for other systems or users outside of Salesforce. One critical aspect of such endeavors is how you are managing the authentication and access to your precious Salesforce data!

Unless you have been under a rock of late, you’ll likely be aware of the now increased focus on managing Connected Apps in your orgs; these are the traditional way in which access to Salesforce is gated and typically require you to create, set up, and manage. While Heroku AppLink also leverages Connected Apps, the setup and configuration is, as you would expect for Heroku DX, fully managed for you.
This blog is going to delve into the more practical side of things, so after a little framing, we’ll start to get deeper into technical details than usual, and as a result, it is a bit longer than typical. As always, there is accompanying source code to explore as well. We will explore integration use cases and how Heroku AppLink is configured to manage access to your org data. Finally, I want to thank Heroku for sponsoring this blog and assure readers, as always, that the words and opinions are my own.
Complete working examples accompany this blog, integration-applink-api, integration-applink-web and integraiton-applink-callout. Associated README files include full instructions on how to deploy these samples yourself and additional technical notes not covered here.
The Heroku AppLink Difference
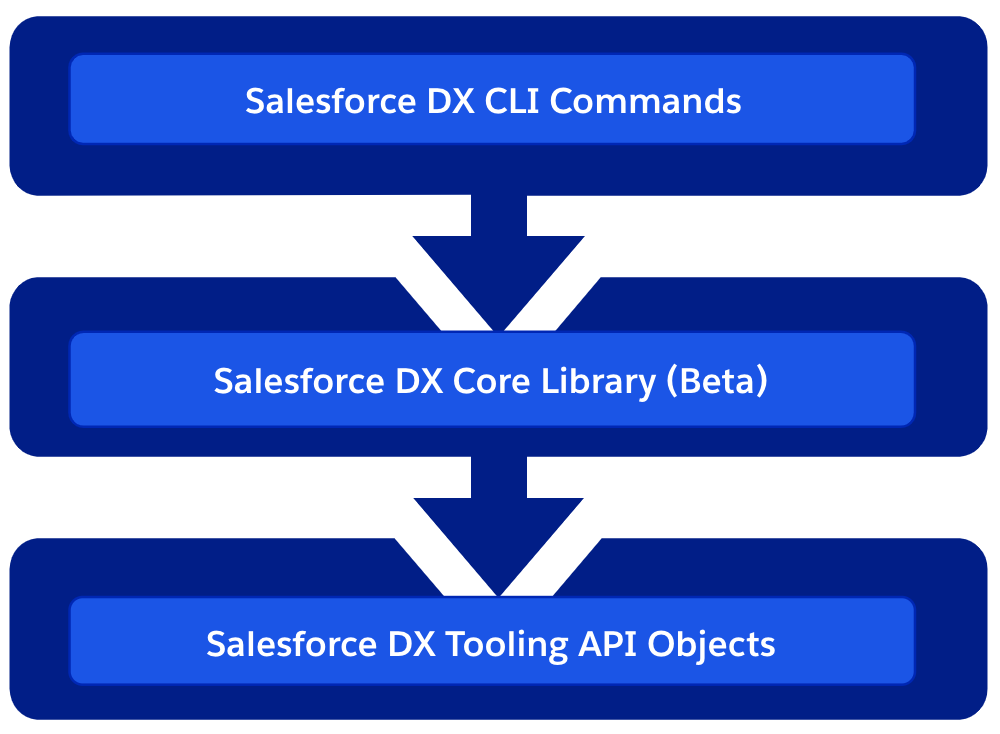
In this blog, we will review what Heroku AppLink is doing and see how it allows you to configure three types of authentication: user, user-plus, and authorized-user. Each of the integration examples below leverages one of these three modes. Simply put, though, user modes are designed for Salesforce to Heroku, and authorized user mode is designed for Heroku to Salesforce, where the Salesforce user is not known – and thus authentication is configured upfront. The following diagram helps illustrate this:

User mode simply requires assigning a permission set to gate access to the Heroku service, and that’s it, the logged-in user within Salesforce is the same user used when performing operations within Heroku-deployed code – the authorization context is seamlessly but securely exchanged.
This is actually the first major plus in my view, as before it was tempting to pass the UI session token (not good practice) or have to resort to re-authentication as some general-purpose user and thus breaking auditability, and typically resulting in over-permissioning around such an “integration user”. Heroku AppLink user mode only works because an authentication context has already been established. However, when the flow of control originates outside of Salesforce, there still has to be an authentication process required, no escaping that. Heroku AppLink does allow you to define one or more pre-authenticated users that you set up beforehand and reference in your code via an alias – more on this later.
Heroku DX provides a full CLI and UI dashboard for admins to see what connections have been connected to specific orgs. There is also a bunch of permissions and controls within Salesforce as well – that we will get into a little later! Meanwhile, here are a couple of examples of the AppLink dashboard.


Exploring Integration Types
Integrations come in various forms; at a high level, there are those that are triggered by an action within Salesforce by an authenticated, logged-in user or those that occur as a result of an external system or user that is not a Salesforce user. These integration types fit perfectly with the Heroku AppLink authentication modes, as the table below explains.
| Integration Type | Usage | AppLink Authentication Mode |
| Web Site Data Integrations Code: integration-applink-web | Public or gated websites/mobile applications that wish to leverage Salesforce data in some direct or indirect form. Calculations, summary info, validations etc. May also have their own authentication, but is not linked to a Salesforce user. | Authorized User |
| Data Ingest APIs Code: integration-applink-api | Public or gated APs that leverage as part of their implementation access to Salesforce, for example APIs that are tailored to a certain type or structure of data that requires some form of coded transformation before data can be inserted into one or more Salesforce object. | Authorized User |
| Third Party API Callouts initiated from within Salesforce Code: integraiton-applink-callout | Integrations that flow from actions or events within a Salesforce org as a result of an authenticated users action or asynchronous process, such as a button press or platform event. Here Heroku deployed code can be used as a middleware to perform additional compute , query additional org data, orchestrate callouts and transform data from Salesforce format to that of the external API. | User Mode |
| Managing Additional Integration Permissions Code: integraiton-applink-callout | As an extension to integrations that flow from within Salesforce, as in the above use case, additional object and field access maybe required beyond that of the invoking user – without having permanently grant that user such permissions. | User Mode Plus |
| Async Integration Callbacks to Salesforce Code: integraiton-applink-callout | Integration operations that exceed HTTP callout limits can leverage async HTTP callbacks to the Salesforce org once they have completed their processing. Such callbacks directly invoke Apex code handlers running with the authority of the invoking user. | User Mode / User Mode Plus |
In the following sections, we start to get deeper into the weeds of the above use cases and how to configure Heroku AppLink, along with exactly what Heroku AppLink is setting up for you.
Web Site Data Integration
Imagine you are a product marketing team and want to engage influencers on your latest campaigns managed within Salesforce. Influencers will not have Salesforce logins. In the past, you might have built such a site and stored those in a related database or even updated the web pages manually as new campaigns launched and completed.
With a data integration to Salesforce, the website can extract approved information from the Campaign object dynamically, ensuring it’s always up to date. You could even extend this further by allowing influencers to show an interest and have that updated within a related object in Salesforce, triggering internal workflows for review and approval. Here is what our example looks like:

The above page is updated by an endpoint that dynamically fetches the records using the AppLink SDK. It uses the AppLink Node.js SDK to retrieve a pre-authorization; this is effectively the authorized user mode we discussed earlier, and that’s it, you can then go on to make SOQL or DML requests:
    const connectionName = (process.env.CONNECTION_MARKETING ?? '').trim();
    const org = await sdk.addons.applink.getAuthorization(connectionName);
    const query = `
      SELECT Id, Name, Status, Type, StartDate, EndDate, Description
      FROM Campaign
      ORDER BY StartDate DESC
    `;
    const result = await org.dataApi.query(query);
    const campaigns = result.records.map((record) => {
      const fields = record.fields;
      return {
        id: fields.Id,
        name: fields.Name,
        status: fields.Status,
        type: fields.Type,
        startDate: fields.StartDate,
        endDate: fields.EndDate,
        description: fields.Description
      };
    });

The important thing here is that in the code above there is no need for Connected App OAuth secrets, token management, JWT certs, or other logic; the SDK is basically calling the AppLink API to obtain a token for you. To break this down further, let’s replicate the getAuthorization SDK call via curl using the /authorizations AppLink API.
curl \
  -H "Accept: application/json" \
  -H "Authorization: Bearer $(heroku config:get HEROKU_APPLINK_TOKEN)" \
  -H "X-App-UUID: $(heroku config:get HEROKU_APP_ID)" \
  "$(heroku config:get HEROKU_APPLINK_API_URL)/authorizations/influencerPortal" \
  | jq .
The above curl command uses the jq command to parse AppLink env vars and display the API result in a friendly format where we can see the typical domain, user, and token values required to call Salesforce APIs:
{
  "id": "132bfc86-b21d-49b4-b1b4-2cf81ab495dc",
  "status": "authorized",
  "org": {
    "id": "00DDS0000021BzL2AU",
    "type": "SalesforceOrg",
    "instance_url": "https://flow-saas-46-dev-ed.scratch.my.salesforce.com",
    "developer_name": "influencerPortal",
    "api_version": "65.0",
    "user_auth": {
      "username": "test-ai0lpezjm5sh@example.com",
      "user_id": "005DS00000yYLD1YAO",
      "access_token": "00DDS0000021BzL!ARwAQN.....C2H9BHnf"
    }
  },
  "created_at": "2025-11-12T16:32:16.883198Z",
  "created_by": "andy@blah.com",
  "created_via_app": "ancient-meadow-82726",
  "last_modified_at": "2025-11-12T16:33:32.454538Z",
  "last_modified_by": "andy@blah.com"
}
You can also run the command heroku applink:authorizations:info, which also uses the same API. You may have noticed that the above example uses some HEROKU_APPLINK_ env variables to gain access to the AppLink API. These are only supplied to your Heroku application as part of adding the Heroku AppLink addon. Only the Heroku app owners can download these environment variable values—and thus, how we can also run such apps and tests locally per the instructions in the README files.
Note: The
HEROKU_APP_IDenvironment is something you can pretty much ignore once set (see below). Without getting into details, it is more of an implementation detail being surfaced at this point and will hopefully be removed from the user-facing experience in the future.
You may also be wondering about the connectionName / developer_name variables used in the above code and CURL example. This is effectively an alias used to reference a prior authentication of a given user to a given org; in this case, ours is influencerPortal (named after its usage in this case). The CLI and API can be used to make these authorizations, both in interactive and headless modes (useful for your DevOps pipelines).
Finally, to set all this up, below are the CLI commands used by the sample code included here to create a Heroku app, install the Heroku AppLink addon, and then authorize a user with our influencerPortal alias. Finally, the code is deployed to Heroku (steps are also provided in the README for local development). This alias is then configured via the CONNECTION_MARKETING env var above in the code.
# Create a Heroku app and install the AppLink add-on
heroku create
heroku addons:create heroku-applink --wait

# Authorize the org (popups up Salesforce login page)
heroku salesforce:authorizations:add influencerPortal -l https://test.salesforce.com

# Expose the connection name and app ID to the dyno
heroku config:set CONNECTION_MARKETING=influencerPortal
heroku config:set HEROKU_APP_ID="$(heroku apps:info --json | jq -r '.app.id')"

# Deploy the API to Heroku
git push heroku main
In order to configure AppLink in an org, your user will need the Manage Heroku AppLink permission; otherwise, any authentication attempt will fail. The salesforce:authorizations:add CLI command prompts you in the browser during the login (headless JWT auth is also available) to accept a number of confirmations – these confirm the permissions Heroku AppLink is being given in your org – so be sure to review these carefully:


If you review your Connected App OAuth Usage page will see the Heroku Credentials Service:

Since you name these authenticated connections, you can, of course, use as many as you like – connecting many orgs to your service or app. Perhaps you do want to designate different users for different purposes, or even have the code read from different orgs! That’s right, the AppLink add-on supports multiple orgs. There is a great example of this in the standard documentation samples here.
As final note, although the AppLink SDK was used here, you can call the AppLink API directly as well, and once you have the domain and session Id you can of course use Salesforce APIs directly. Especially useful if your not using Node.js or Python, since the SDK is currently only availble in these languages. The Heroku AppLink API is fully documented here.
Data Ingest APIs
Heroku can also be a great place to host coded custom APIs that simplify data ingestion from one format into that which the Salesforce APIs and your data model expect. In this example, imagine we are a consumer-facing business, and every month we want to ingest product updates from our suppliers. This API will create or update product information accordingly, using the productCode as an external reference.

The following curl will exercise the API from the locally running web server:
curl -s -X POST http://localhost:3000/api/products/import \
  -H "Content-Type: application/json" \
  -d '{
    "products": [
      {
        "productCode": "CAT-1001",
        "name": "IoT Sensor Hub",
        "description": "Wireless sensor hub with remote monitoring",
        "family": "Hardware",
        "price": 799
      },
      {
        "productCode": "CAT-1002",
        "name": "Edge Camera Module",
        "description": "AI-enabled camera module for edge analytics",
        "family": "Hardware",
        "price": 499
      },
      {
        "productCode": "CAT-1003",
        "name": "IoT Device Toolkit",
        "description": "Starter toolkit for onboarding connected devices",
        "family": "Services",
        "price": 199
      }
    ]
  }'
Once again, in reality, it’s expected that this API would also have its own authentication schema suppliers use, but this is not based on Salesforce users. Before we move on from this point, it’s worth pointing out that building your own authentication for web or API endpoints is generally not a good idea; instead, seek out support from frameworks such as Spring Boot, .NET or API gateways such as Mulesoft.
Once more, the AppLink authorized user mode is used to integrate with Salesforce data to upsert the transformed records. I originally hoped to use the AppLink SDK’s Unit of Work feature for this, a handy wrapper around the composite API; however, it does not support upsert operations presently. This, however, gave me a new opportunity to highlight a great fallback feature of the AppLink SDK, the org.request method. This method allows you to directly call Salesforce APIs, as shown below, but still take advantage of AppLink adding the authentication details for you—nice!
    const compositeResponse = await org.request(
      `services/data/v${org.apiVersion}/composite`,
      {
        method: 'POST',
        headers: {
          'Content-Type': 'application/json'
        },
        body: JSON.stringify({
          allOrNone: false,
          compositeRequest: compositeRequests
        })
      },
      true
    );
It’s worth also noting that languages such as Node.js support easy ways to make parallel Salesforce API invocations, which are of course possible, allowing you to reduce ingest execution time dramatically (see this example here for more). Be careful to profile and test such approaches though to check for deadlines and conflicts. You can review the full implementation of the API here.
Finally, worthy of reference here is Heroku Connect; this addon uses a Heroku Postgres database that syncs with your Salesforce org data. In this case, you’re using SQL to write to Postgres, so performance is improved over Salesforce APIs, at the trade-off of maintaining a copy of your data in Postgres. This option really needs to justify itself accordingly.
Third Party API Callouts initiated from within Salesforce
In cases where Salesforce is not the system of record, it is common to initiate integrations from within Salesforce to trigger processes elsewhere. Imagine we are selling cloud infrastructure services, and each time an opportunity is closed, we want to automate the provisioning of those services. We are using Heroku-deployed code to integrate with Salesforce data and transform it into a format required by the third-party provisioning APIs. Provisioning can take some time, so processing returns back to Salesforce via callbacks that trigger Apex, which can send notifications to the user, for example.

Apex (or Flow or AgentForce for that matter) can be used to call the Heroku-deployed code that is managing and orchestrating third-party API calls. Here we have an Apex code fragment that invokes Heroku-deployed code and provides an Apex class, offering a callback (more on this later):
// Provisioning orchestration service request
HerokuAppLink.ProvisioningService service = new HerokuAppLink.ProvisioningService();
HerokuAppLink.ProvisioningService.provisionServices_Request request =
       new HerokuAppLink.ProvisioningService.provisionServices_Request();
request.body = new HerokuAppLink.ProvisioningService_ProvisionServicesRequest();
request.body.opportunityIds = opportunityIds;

// Create callback handler for notifications
ProvisioningCallback callbackHandler = new ProvisioningCallback();

// Set callback timeout to 60 minutes from now
DateTime callbackTimeout = DateTime.now().addMinutes(60);

// Call the service with callback
HerokuAppLink.ProvisioningService.provisionServices_Response response =
        service.provisionServices(request, callbackHandler, callbackTimeout);
The above Apex is, of course, already running as an authenticated Salesforce user, and due to AppLink user mode, the following Node.js code that performs additional SOQL queries is also operating as that user as well. As such, the same profile, permission set, and sharing rules apply – ensuring that provisioning only occurs with opportunities that the user has access to! Users also need an additional permission to invoke the Heroku service.
In the code deployed to Heroku, we are using Node.js Fastify to implement the API. In its route handler, we can see request.salesforce is a reference to the Heroku AppLink SDK being used once again to obtain a secure authentication to Salesforce. Additionally, notice that Salesforce passes in a callback URL:
  fastify.post('/provisionServices', {
    schema: provisionServicesSchema,
    handler: async (request, reply) => {
      const { opportunityIds, callbackUrl } = request.body;
      const jobId = crypto.randomUUID();

      // Check for Heroku AppLink context from middleware
      const client = request.salesforce;
      if (!client || !client.context || !client.context.org || !client.context.org.dataApi) {
        request.log.error('Salesforce context not available in request');
        return reply.code(401).send({ error: 'Salesforce context required. Ensure x-client-context header is present.' });
      }

      // Respond immediately with 201 for async operation
      reply.code(201).send({ jobId });

      // Process provisioning asynchronously
      setImmediate(async () => {
        try {
          await provisionServices(
            jobId,
            opportunityIds,
            client,
            callbackUrl,
            request.log
          );
        } catch (error) {
          request.log.error({ err: error, jobId }, 'Error processing provisioning job');
        }
      });
}
The above relies on a Fastify HTTP processing middleware hook (not shown but included in the sample code as /src/server/middleware/salesforce.js) that calls the Heroku AppLink SDK to parse a unique HTTP header. This header is passed from Salesforce that works together with the addons environment variables to retrieve a secure connection using the invoking user’s authority. Further code is able to query the opportunities to orchestrate calling the actual underlying provisioning APIs (not shown) and eventually uses the AppLink SDK again to callback to Salesforce:
// Query opportunities and line items
const opportunityIdList = opportunityIds.map(id => sanitizeSalesforceId(id)).filter(Boolean).map(id => `'${id}'`).join(',');
const oppQuery = `
  SELECT Id, Name, AccountId, CloseDate, StageName, Amount,
         (SELECT Id, Product2Id, Product2.Name, Quantity, UnitPrice, PricebookEntryId FROM OpportunityLineItems)
  FROM Opportunity
  WHERE Id IN (${opportunityIdList})
const opportunities = await queryAll(oppQuery, { context: { org } }, logger);

// Process opportunity lines items to provision services ...
// ...

// Callback to Salesforce Apex handler to notify user
const callbackResults = {
  jobId,
  opportunityIds,
  services,
  summary,
  status: 'completed',
};
const requestOptions = {
  method: 'POST',
  headers: { 'Content-Type': 'application/json' },
  body: JSON.stringify(callbackResults)
};
await org.request(callbackUrl, requestOptions);
We will explore the Apex callback code later; for now, we have seen the code. Let’s take a look at how Heroku AppLink was configured to allow this use of user mode to work. Unlike the above examples, we are not authenticating a specific user; we are granting users permission to call the Heroku service. To do this, we must publish that service into one or more orgs. The following AppLink CLI commands are used:
# Connect to Salesforce org
heroku salesforce:connect my-org -l https://test.salesforce.com

# Publish API to Salesforce using the OpenAPI schema defined in api-docs.yaml
heroku salesforce:publish api-docs.yaml --client-name ProvisioningService --connection-name my-org

# Assign Permission Sets to allow your user to invoke the Heroku code
sf org assign permset --name ProvisioningService
sf org assign permset --name ProvisioningServicePermissions
As we experience in the previous use case, the browser-based interactive login is used; however, this user is not the user used to invoke the Heroku service. That’s still the user logged in at the time the service is called since we are in user mode here. The permission sets are generated by AppLink and are required to be assigned to any user invoking the service. The second permission set, ProvisioningServicePermissions, allows you to add additional permissions required by the service (more on this later). Here is what the service looks like once published, under the Setup menu:

Heroku AppLink has gone ahead and created Connected Apps and External Services for you. Note that the External Services show a source of Heroku, indicating these are managed by Heroku, not the org admin. In normal practice, you do not need to interact with these, but it is important to know they exist, especially as you should now become aware of all Connected Apps used in your org—right!


Managing Additional Integration Permissions
In some cases, integrations require information that the invoking user does not have access to. Rather than adding that permission to the user and just not telling them about it—which is bad, of course, right?! Instead, we can add additional object and field permissions to a permission set created by AppLink. Imagine that we have provisioning parameters stored in a ProvisioningParameters__mdt custom metadata type object. By adding permissions to the ProvisioningServicePermissions permission set, the code can now query this object—but the sales person otherwise cannot:
// Query provisioning parameters from custom metadata
const paramResult = await dataApi.query('SELECT Name__c, Value__c FROM ProvisioningParameter__mdt');
const provisioningParameters = paramResult.records.reduce((acc, record) => {
  const fields = record.fields || record;
  if (fields.Name__c) acc[fields.Name__c] = fields.Value__c;
  return acc;
}, {});
The ProvisioningServicePermissions permission set is created as a Session Based permission set, which means it does need to be assigned to users but it will not be activated until the system assigns it to them. In this case the system is Heroku AppLink, which is automatically activating it during Heroku code execution and deactivating it after. This is what AppLink refers to as user plus mode.


You can also find another example of this elevation pattern here.
Aysnc Integration Callbacks to Salesforce
Some integrations are long-running; for example, in our provisioning case, it might take several minutes to provision all services sold—well beyond the synchronous HTTP callout limit of Apex. In this case, Heroku AppLink supports secure callbacks to Salesforce that invoke Apex code. In fact, it can support multiple callbacks, allowing for progressive updates to be made back to Salesforce if required.
The Apex code from the previous example showed a callback handler being provided to send notifications to the salesperson once the provisioning was complete – this could also perform updates to the Opportunity record itself:
public class ProvisioningCallback
    extends HerokuAppLink.ProvisioningService.provisionServices_Callback {

    // Static variable to store the notification type ID
    private static Id notificationTypeId;

    // Static constructor to query the CustomNotificationType once when class is loaded
    // ...

    /**
     * Handles the callback response from the Heroku application
     * Sends a custom notification to the user with the results
     */
    public override void provisioningStatus(List<HerokuAppLink.ProvisioningService.provisionServices_provisioningStatus_Callback> callbacks) {
        // Send custom notification to the user
        for (herokuapplink.ProvisioningService.provisionServices_provisioningStatus_Callback callback : callbacks) {
            List<herokuapplink.ProvisioningService_provisioningStatusCallback_IN_body_services> services = callback.response.body.services;
            if (services != null && !services.isEmpty()) {
                for (herokuapplink.ProvisioningService_provisioningStatusCallback_IN_body_services serviceResult : services) {
                    Messaging.CustomNotification notification = new Messaging.CustomNotification();
                    notification.setTitle('Service Provisioning Update');
                    notification.setNotificationTypeId(notificationTypeId);
                    notification.setBody(serviceResult.message);
                    notification.setTargetId(UserInfo.getUserId());
                    notification.send(new Set<String>{ UserInfo.getUserId() });
                }
            }
        }
    }
}
The Apex callbacks run as the original user also, so once again maintaining a security flow of permissions that are bounded by the user’s permissions. Finally, if you want to know more about this pattern, I covered it more in depth in my previous blog here – in terms of the required changes to the OpenAPI specification provided when publishing the service.
Summary
As the world continues to build more services and generate more data, the more humans and now AIs become users of them – the need for ensuring those integrations are built securely increases. While I have been around long enough to know some of what it takes, including a pretty good understanding of OAuth – it’s simply an area I do not focus on – I build apps and services, not infrastructure.
Heroku and Salesforce engineers are, however, focusing on this. Heroku AppLink, Connected Apps (or External Client Apps more recently) are all technologies we should be learning vs. the more DIY approaches of the past. Complete working examples accompany this blog, integration-applink-api, integration-applink-web and integraiton-applink-callout. Associated README files include full instructions on how to deploy these samples yourself and additional technical notes not covered here. Here are some additional resources:
- Additional Code and Information for this Blog
- Extend Salesforce with Any Language
- AppLink Fundamentals I: Integration Patterns – Connecting Salesforce to Heroku Applications
- AppLink Fundamentals II: Advanced AppLink Integrations – Automation & AI
- AppLink Fundamentals III: Building with AppLink – Development Flow and Language Choices
- AppLink Trailhead
- Overview
- Getting Started Guides
- CLI Guide
- API Guide
- Node.js SDK
- Python SDK
- Sample Code (Java, Node.js)
- How External Services Asynchronous Callbacks Work
- Heroku Trailhead


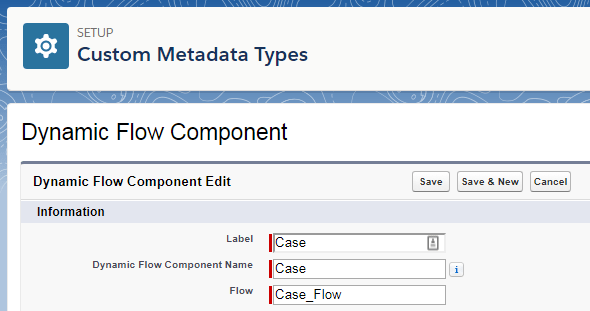
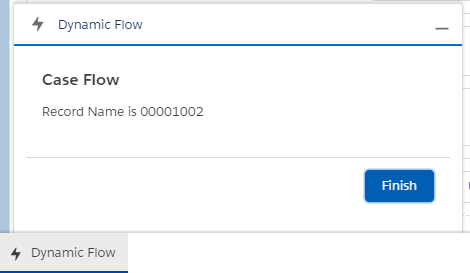 The Dynamic Flow Component (DFC) allows you to further extend your use of auto launch and screen
 Its been nearly 9 years since i created my first Salesforce developer account. Back then I was leading a group of architects building on premise enterprise applications with Java J2EE and Microsoft .Net. It was fair to say my decision to refocus my career not only in building the